监控告警:
Prometheus + grafana +alertmanager
Prometheus 介绍:
更多请参考官方文档: https://prometheus.io/docs/
什么是prometheus :
Prometheus 是一个开源的监控系统,和告警工具,被多家公司所采纳监控。
特征:
1 . 是一个多维数据模型,具有由度量名称/键值对标志的时间序列数据。
2. 是一种灵活的查询语言
3. 单个服务节点是自制的, 不依赖分布式存储
4. 时间序列通过http 的拉取模式
5 . 推送时间序列通过中间网关支持
6 . 通过服务发现和配置来来发现目标
7. 多种模式的图形和仪表盘支持
Prometheus 构成:
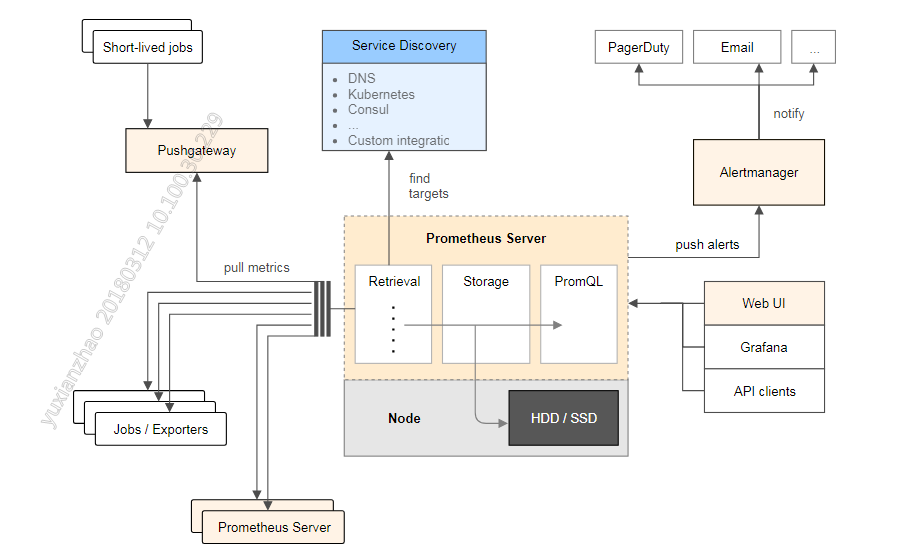
解释:
主要是用来抓取和存储时间序列,分为Prometheus Server 主要分为三个组成部分, Retrieval 主要是用来服务发现配置的, Storge 主要用来存储数据,PromQL 高级查询语句:抓取方式:
主要是通过Jobs/Exporters 和中间网关拉取 metrics,并推送告警规则 alertmanager , 总的来说是, Prometheus直接或通过中介推送网关从短期工作中提取仪器化工作的指标。它在本地存储所有抓取的样本,并对这些数据运行规则,以聚合和记录现有数据的新时间序列或生成警报。Grafana或其他API消费者可用于可视化收集的数据。
适用范围;
以机器为中心的监控和高度动态的面向服务体系的监控,支持多维数据的收集 和查询。prometheus可靠,但是不但是数据不会是百分一百的准确性的(比如按请求计费)
Prometheus 安装部署:
下载Prometheus ,解压:
1 tar xvfz prometheus-*.tar.gz
2
3 cd prometheus-*
配置Prometheus.yml
global:scrape_interval: 15sevaluation_interval: 15srule_files:# - "first.rules"# - "second.rules"scrape_configs:- job_name: 'prometheus'static_configs:- targets: ['localhost:9090'] global :是全局配置, rule_files 是告警规则配置,也可以适用正则, 第三部分是抓取配置(比如redis监控信息),
scrape_interval表示每隔多久抓取一次, evaluation_interval 表示多久一次评估规则,--》 生成告警
*.rules 告警规则文件。
scrape_configs: 配置完成,我们可以通过:http:// localhost:9090 / metrics来抓取。
重启Prometheus : Curl -X Post http://localhost:port//-//
http_requests_total{code="200"} 表达式 可以查询信息.(参考表达是语言文档)

从官网下载 Exporter
tar xvfz node_exporter-*.tar.gz
cd node_exporter-*

启动
./node_exporter
需要配置Job_Name:
- job_name: nodestatic_configs:- targets: ['localhost:9100']
重启Prometheus ,就可以在consule 看到监控指标了。
Prometheus 度量类型:

1 .counter
一个计数器是代表永远只上升1个数值累计度量。计数器通常用于计数提供的请求数,完成的任务数,发生的错误数等。
2 .Gauge
仪表通常用于测量值,如温度或当前的存储器使用情况,但也可以上升和下降的“计数”,如正在运行的goroutines的数量。
3. histogram
具有基本度量标准名称的直方图<basename>在刮取期间显示多个时间序列:
- 观察桶的累计计数器,暴露为
<basename>_bucket{le="<upper inclusive bound>"} - 总和的所有观察值的,公开为
<basename>_sum - 该计数已观察到的事件的,公开为
<basename>_count(等同于<basename>_bucket{le="+Inf"}上文)
使用该 histogram_quantile()函数 从直方图或直方图聚合中计算分位数。直方图也适用于计算 Apdex分数。在桶上操作时,请记住直方图是 累积的。有关直方图使用情况和摘要差异的详细信息,请参阅 直方图和摘 要。
4. Summary
Similar to a histogram, a summary samples observations (usually things like request durations and response sizes). While it also provides a total count of observations and a sum of all observed values, it calculates configurable quantiles over a sliding time window.
A summary with a base metric name of <basename> exposes multiple time series during a scrape:
- streaming φ-quantiles (0 ≤ φ ≤ 1) of observed events, exposed as
<basename>{quantile="<φ>"} - the total sum of all observed values, exposed as
<basename>_sum - the count of events that have been observed, exposed as
<basename>_count
See histograms and summaries for detailed explanations of φ-quantiles, summary usage, and differences to histograms.